Know the condition of your entire property — in 3 days.
One drone flight. One system. Pavement, roofs, and landscape — assessed together and delivered in a format you can use immediately.
What a single flight returns.
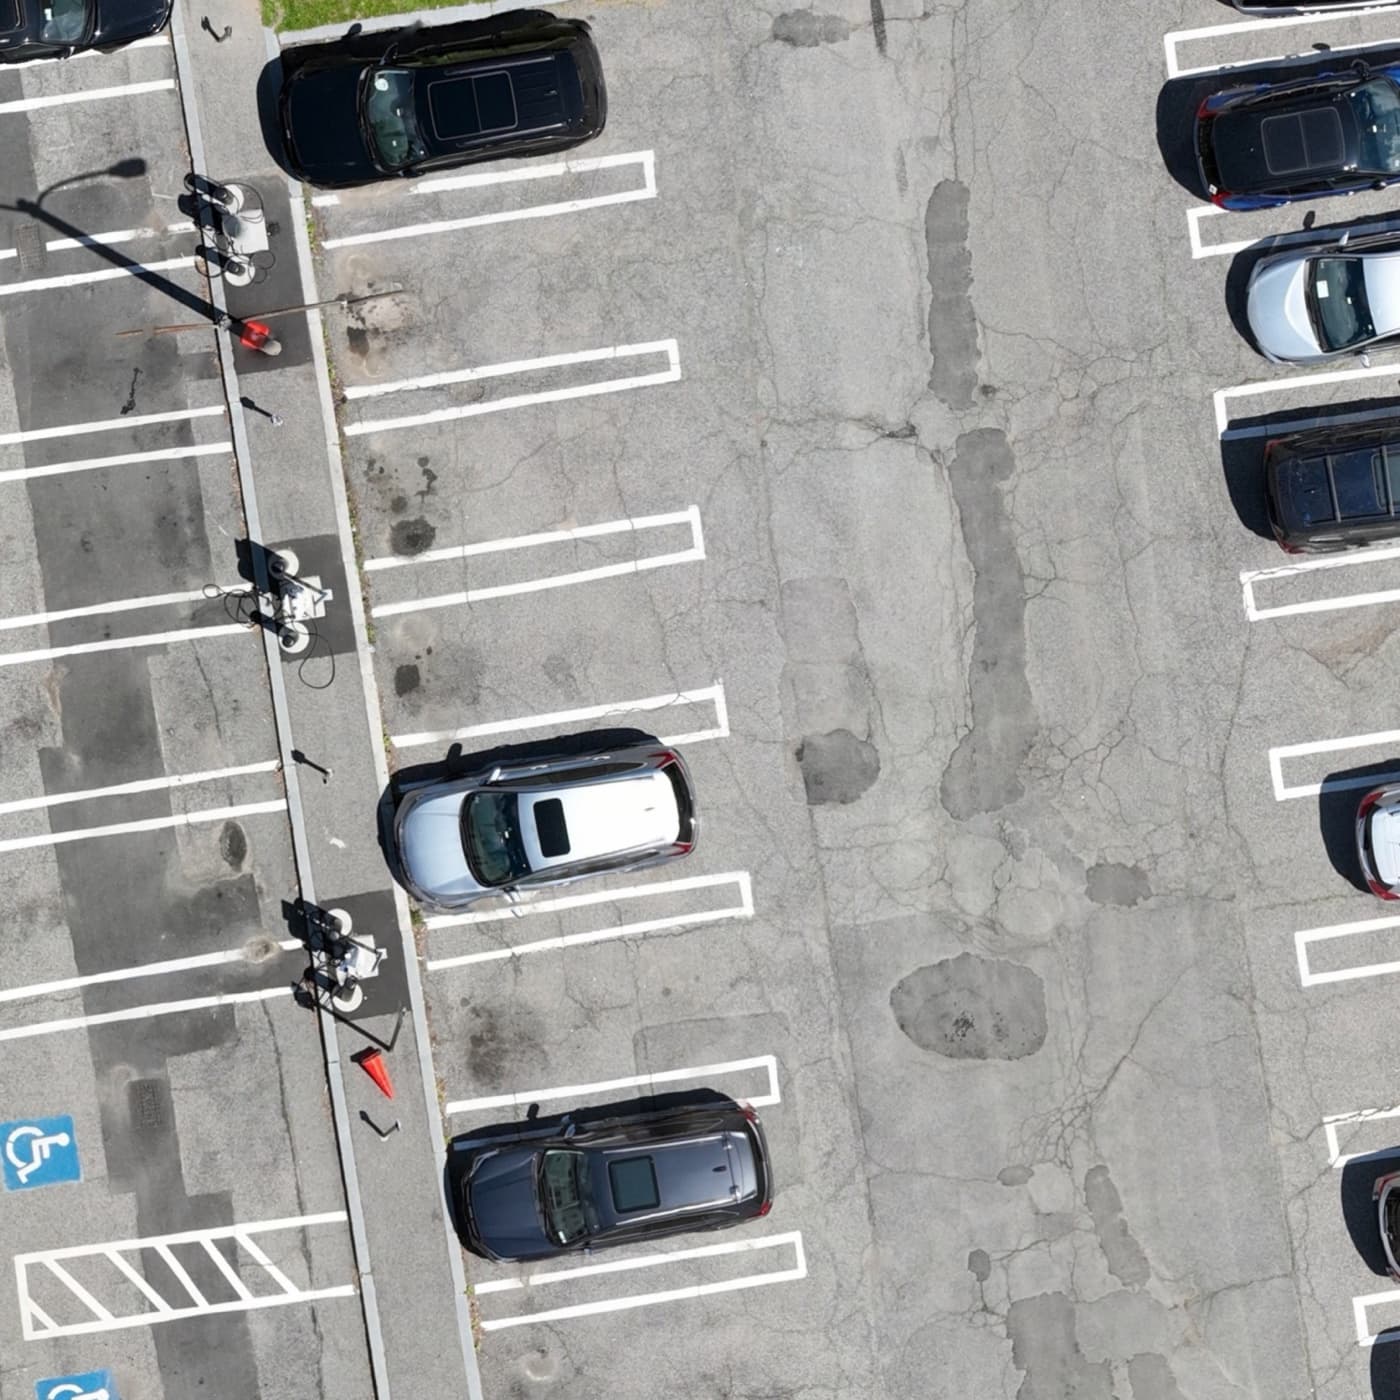

Drag to reveal the condition layer LandOS returns from one flight.
Overlays
- Crack vectors
- Roof condition
- Drainage issues
- Site risks
Site zones
Top actions
- Repair pavement segments
- Inspect roof penetrations
- Clear drainage paths
- Resolve egress risks
This is how every property is assessed.
Property data takes too long and comes back fragmented.
Multiple vendors. Different formats. Weeks of waiting. By the time reports arrive, conditions have already changed — and costs have gone up.
Three vendors, three calendars.
Pavement, roofing, and landscape consultants each bring their own scope, schedule, and invoice.
Three formats, zero comparability.
PDFs in three templates, measurements in three units, no single dataset to drop into the capex memo.
Damage compounds while you wait.
A $4k crack becomes a $40k repair while the report sits in someone's inbox.
What you get
A complete property view, delivered together.
All three condition reports in one delivery, on the same system.
Pavement and concrete
Condition scoring, crack mapping, repair planning.
Roofing systems
Material condition, drainage issues, replacement signals.
Landscape and grounds
Health, overgrowth, maintenance priorities.
Platform
Your property data doesn't disappear after the report.
Every assessment stays available in the platform.
Review past conditions. Compare across time. Share with your team.
Consistency
Same process. Same output. Every property.
Every site is evaluated using the same system, so results are consistent across your portfolio.
No variation between vendors. No guessing how scores were determined.
Ready for 3-day property intelligence?
Send us a property — a single address, or a whole portfolio. We respond within 24 hours and return a complete property assessment in 3 days.